Whenever you talk to another football fan about the state of the European top leagues, you will often hear the same sentiment: 'the league is just boring nowadays, halfway through the season you already know who will win and who will be relegated'. I know, because I'm one of those people. But I'm also one of those people who then immediately wants to know whether this is actually true. So... is European football getting more 'boring'? How would you even quantify that? Well, let me introduce you to Mr. Corrado Gini.
The Gini Coefficient
In 1912, Mr. Gini invented a metric to quantify wealth inequality. Roughly explained, the Gini coefficient (GC) takes a distribution of numbers (usually income or wealth data) and outputs a number between 0 and 1. Distributions with a GC of 0 exhibit perfect equality within those numbers, whereas a GC of 1 means that the distribution is maximally unequal - e.g. one person having all the money and everyone else having nothing. Luckily for me, the same math also works on any other distribution of numbers. And because Mr. Gini is Italian, I'm certain that he would be okay with me using his inequality coefficient to discuss football.
Using the GC for the distribution of league points at the end of a football season should give an estimate of how evenly the teams performed. If a handful of teams dominate while some others never win, the point distribution will result in a high GC. If the league stays close throughout the season and anything could happen until the last match day, the GC will be comparably low. You can call this a measure of equality, evenness, or maybe competitiveness. I will stick with the word (un)equal for this post.
As an example, here's the point distribution of two different seasons of the Spanish Primera División from the seasons 1999/2000 and 2014/2015, with the respective Gini coefficients in the top right:
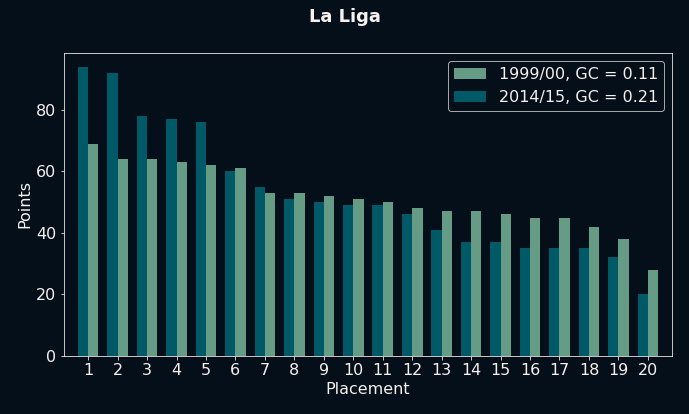
As can be seen, the visually more unequal season 2014/2015 with two dominant teams, three runner-ups and one team in dead last place results in a GC of 0.21, whereas the relatively equal season 1999/2000 results in a GC of 0.11. Being able to represent this difference in a single value therefore gives us an easy measure for which season was more equal (and thus, in the eyes of a neutral fan, more exciting). Moreover, it allows us to find patterns and trends when looking at dozens of seasons across multiple leagues. However, while this is a good start, we still need to do a little more homework in order to interpret the values correctly.
Creating Comparability
In contrast to wealth distributions, there is no way in football for one team to have all possible points while all the other teams have none. In each game, the winner gets three points while the loser gets none. Alternatively, both teams get one point each for a draw. Since every team plays every other team twice, the GC could theoretically be 0 (for example if all teams drew all games), but it could never reach 1, as no two teams could ever have zero points at the end of a season. Instead, there is a maximum possible GC, which changes slightly depending on the number of teams in a league. And since different countries play with a different amount of teams per league (and sometimes change the amount over time as well), a comparison of GCs across different leagues and time horizons is, strictly speaking, not valid.
To combat this, I normalized the GC of each season by the maximum reachable GC based on the amount of teams playing in each league in that specific season. How large is this maximum GC? Well, luckily, Michael from BStat has thoroughly answered that question. Long story short (I tried to derive the equations myself, and after a few minutes I decided it's best for me to trust Michael here), the maximum GC is around 0.378 for the typical 18-team-league and around 0.376 for a 22-team-league. To be able to compare equality across seasons, I normalised every GC by its maximum GC. A season with 18 teams and an absolute GC of 0.189 ended up with a relative GC of 0.189/0.378 = 0.5.
With all GCs being normalized to these values, we're now finally ready to find the answer to our initial question: Did the leagues get more unequal over time? To find out, I calculated the relative GC values for all seasons of the top 5 leagues over the past few decades.
The Results
Let's start with the Premier League. The first of the following three graphs shows the history of the relative GC since 1995, including a linear trend line. The second graph shows how many points the best and worst two teams in each season gathered in the same time period. Lastly, the third graph shows the point distribution of the most and least equal season for this time period.
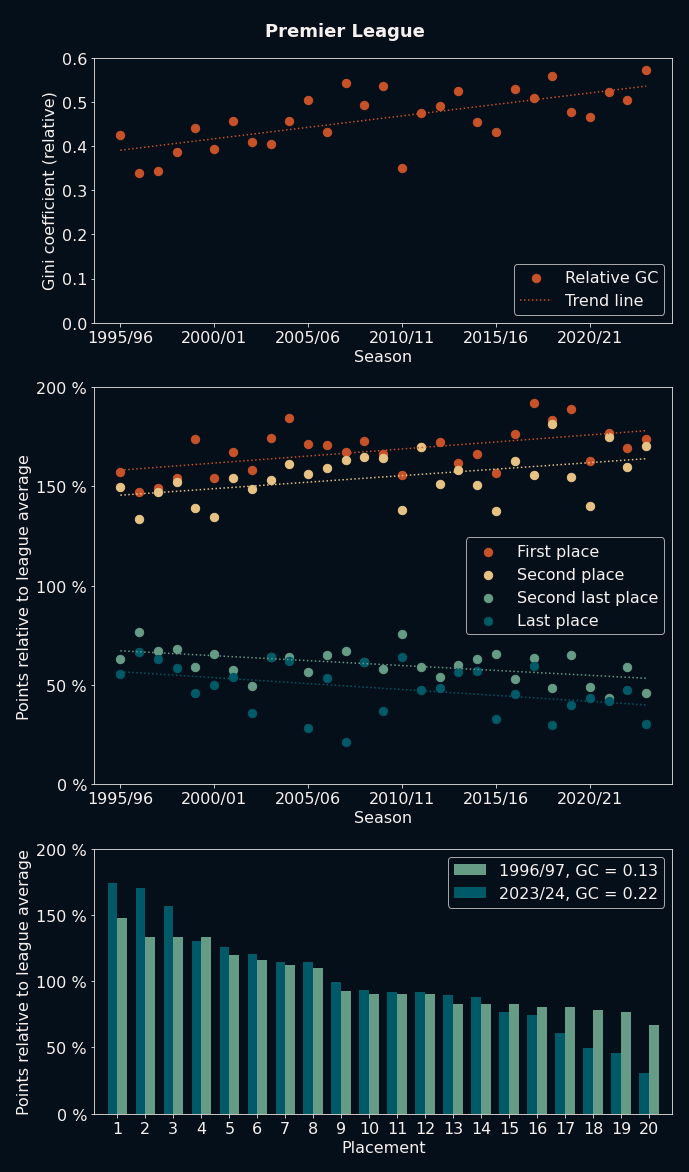
As can be seen here, the Premier League shows a clear trend towards a more unequal point distribution in recent years. The top two teams gain more and more points each season, while the bottom two teams fall back further and further. In the most equal season of 1996/1997, the teams sitting on 13th to 19th place at the end of the season were divided by just three points (one victory!). With 18th and 19th place looking at relegation to the second tier, the tension in the air all across England on the last match of 1997 day must have been palpable. At the same time, the second, third and fourth place teams came in equal on points, and because only one of them could qualify for the prestigious Champion's League, the lucky second place was decided by goal difference alone. Recent newcomer to the league by promotion from the second tier, Leicester City, came in at a respectable ninth place and won the parallel 'League Cup' competition, beating Alex Ferguson's champion team Manchester United on their way. What a great season to watch!
On the other hand, the highest ever recorded GC occurred in the most recent season as of this post. Last place team Sheffield United spent almost the entire season hopelessly in last place, and the top 3 teams were virtually untouchable during the second half of the season. 2023/24 third place team Liverpool gathered more points than 1996/97 champions Manchester United. The difference in points between first and tenth place in 2023/24 was greater than the difference between first and last place in 1996/97. What about an upset like 1996s Leicester City? Well, the three teams who had gotten promoted to the Premier League in the previous season all ended up in the bottom three spots of the table by a good margin. I know which season I would have rather watched as a neutral fan.
But maybe this is just a thing about England. Everyone knows that's where the big money goes to buy tea and crumpets, right? Surely, the other top leagues are different... right? Well, let's look at the same analysis for the German Bundesliga:
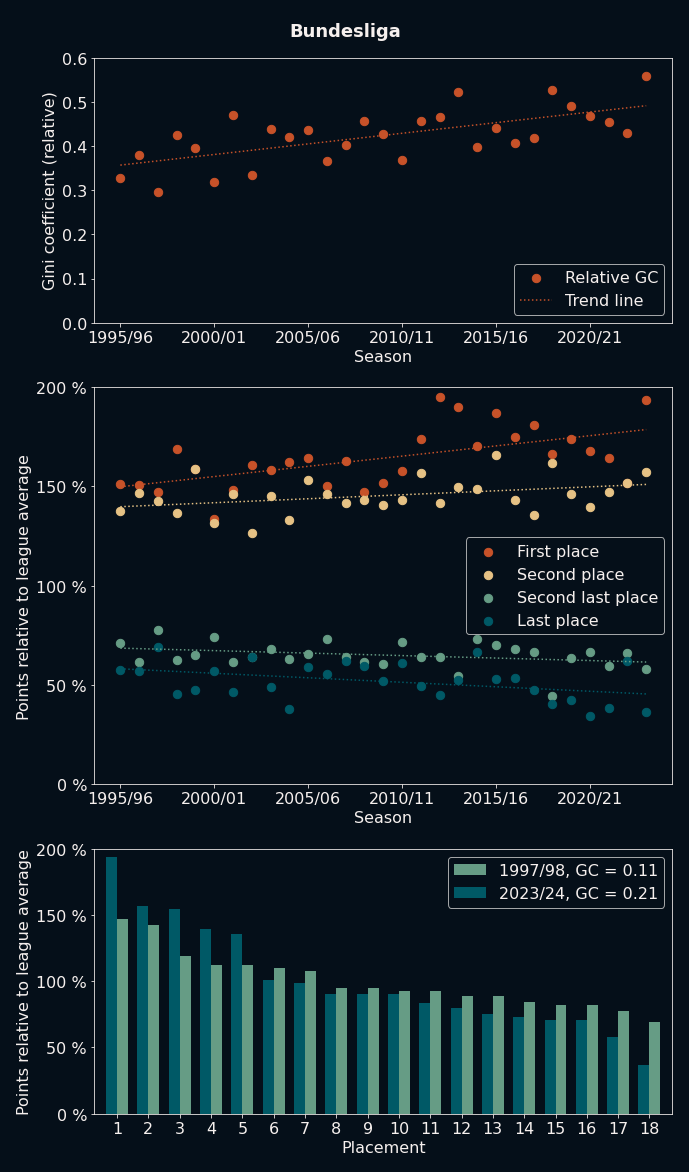
Unfortunately, beer, bratwurst and bureaucracy can not stop the trend either, with inequality slowly but surely creeping up over the years. Again, the most unequal season happened in 2023/24, with the most equal season occurring in the 90s. The lowest GC season in 1997/98 even included a big upset. One of teams who just joined the top tier through promotion, FC Kaiserslautern, managed to win the league with a sensational performance. Their 68 points at the end of the season would have placed them fourth in 2023/24, a whole 22 points behind that year's winner, Bayer Leverkusen.
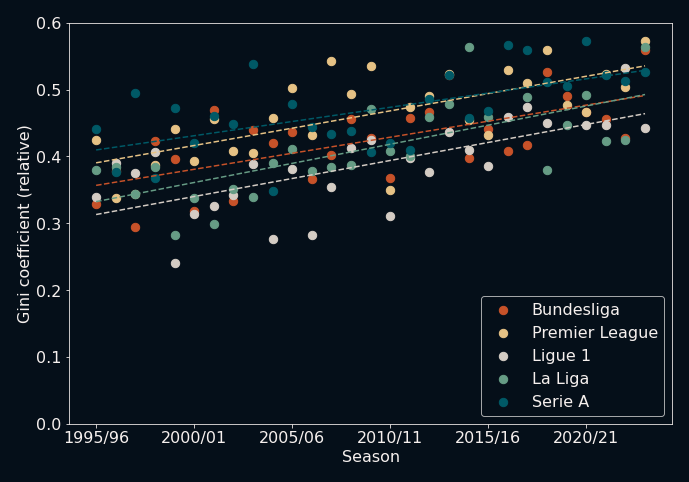
I won't bore you with the same story for the other three leagues, but the TLDR is: the same trend emerges in every one of them. Here's an overview for the sake of brevity:
So... are we all just heading for an unstoppable boring future in football? Is there no hope? Well, maybe, but I wanted to look at one more thing: Each second league loses their best teams to the first leagues after each season due to promotion. Does this help the matter? After a quick modification of my scaping code, here is what the English Championship (second tier) looks like:
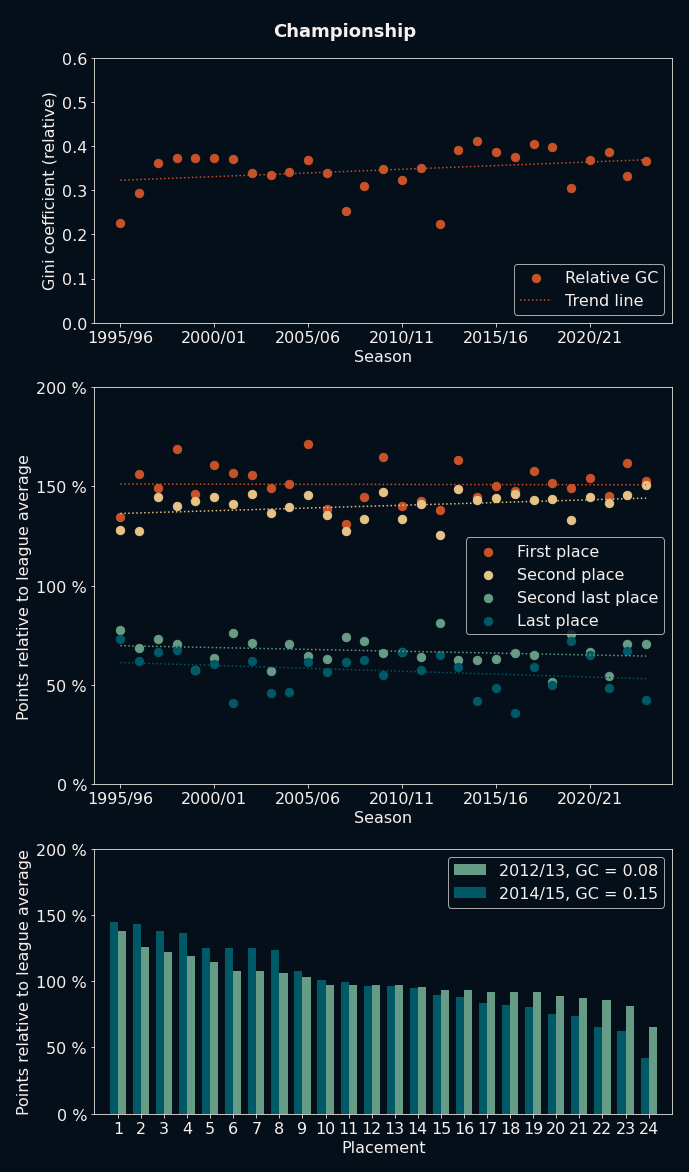
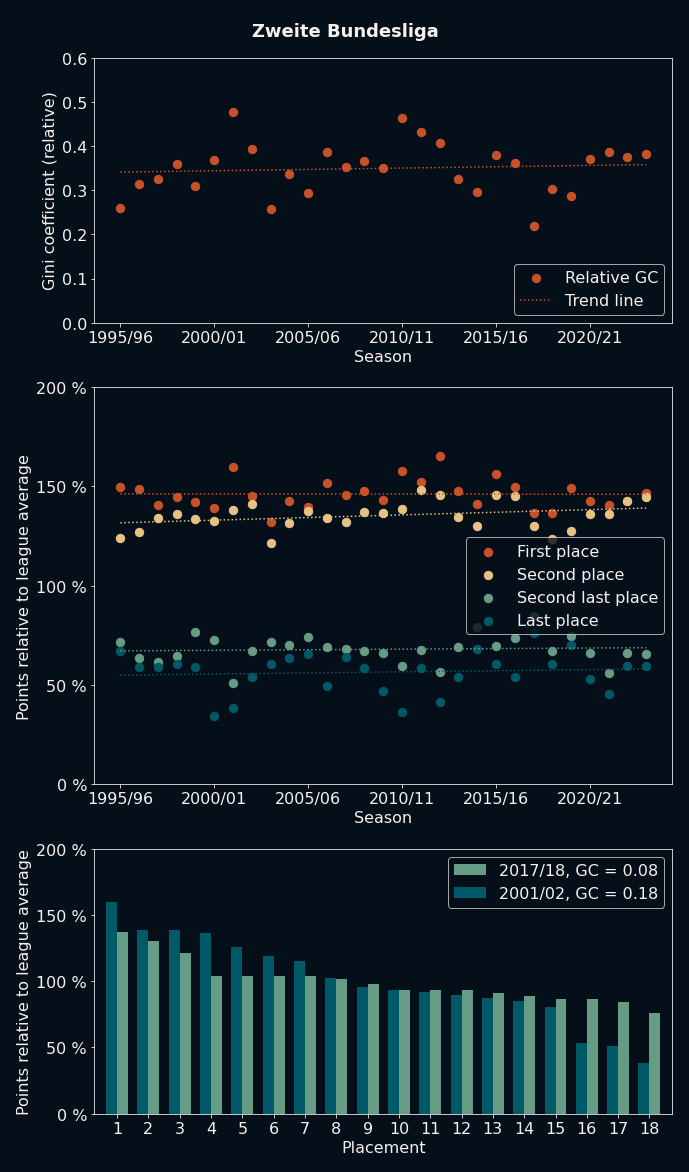
As can be seen here, the trend towards a higher GC is barely visible in the Championship, and pretty much nonexistent in the Zweite Bundesliga. This also holds true for the other second tier leagues:
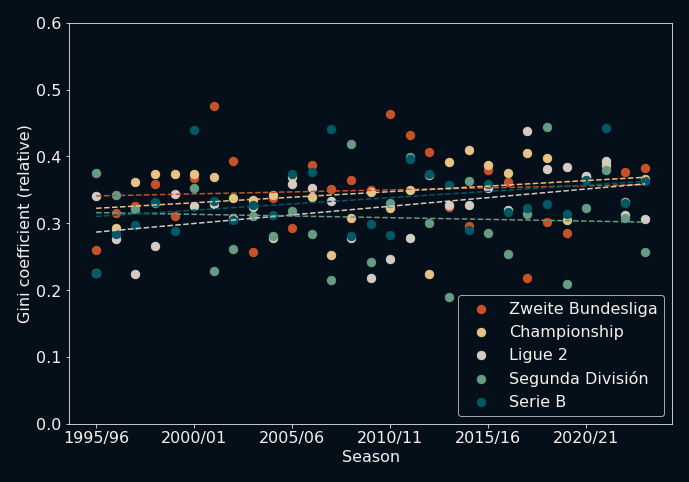
Note how, apart from the missing increase of GC over time, the overall GC values of these leagues are also significantly lower than the ones in each of their top tier counterparts. With their annual natural selection process of promotion and relegation, these second tier leagues seem to be able to keep their competitive spirit and excitement alive.
Conclusions
I guess the answer to the question 'does football get more boring unequal each year' is a resounding 'it depends'. The first tiers of the top 5 leagues show a clear trend towards more and more unequal point distributions, which results in dominant runs of one or two teams and a hopeless season for a few others. The second tier leagues are not even close to the same level regarding this issue. The reasons behind this seem obvious: billions of €£$ being poured into the most successful teams by large investors, who use this money to buy up most of the international talent, only to win more games and be rewarded with more money. A tale as old as capitalism time.
When I was a kid, our family often played Monopoly. The games were good fun up until a certain point, at which someone owned a majority of the assets. After that, it was just a question of slowly bleeding out, so we often just stopped playing and declared the winner. As an adult fan of a bottom-half-first-tier-club, I can't help but feel the same way after seeing my team repeatedly losing 5-0 against the top dogs year after year. However, not everything is as bleak as it seems! If you want exciting games, the second tier of every league is always there to welcome you with their open, competitive arms.
Now, if only this was worth getting relegated for...
Addendum
After writing this post, I searched the internet for similar posts (as I learned that doing this before my fun projects kills all of my motivation, since someone somewhere most likely had a similar enough idea to me). Of course I wasn't the first person to do all this. Here are some resources that deal with similar questions:
Competitive Balance in European Football
Talent concentration and competitive imbalance in European soccer
An Analysis of Parity Levels in Soccer
Determining the Most Competitive Top UEFA League
Is the Premier League Becoming Less Competitive?
Estimating League Disparity Performance with a Point-Rank Gini Index
Which of Europe’s top leagues are the most competitive?
Also, after writing the word unequal so much, I was wondering why we say unequal but not unequality, or even inequal. Well, Merriam Webster says unequal came from just putting un- in front of an existing word to negate it, while inequality was taken directly from Latin a century earlier. But... why did inequal then not take root? Oh well...